Three-particle templates for boosted Higgs
- Almeida, Leandro G. et al
- arXiv:1112.1957YITP-SB-11-46CERN-PH-TH-2012-031
 | Stages of the template method described in text. |
 | A scatter plot of two-parton template overlap {\it vs.} three-parton template overlap for LO parton-level MC output for Higgs decay, with jet energy, $P_0=1\TeV$, $m_{H}=120\GeV.$ |
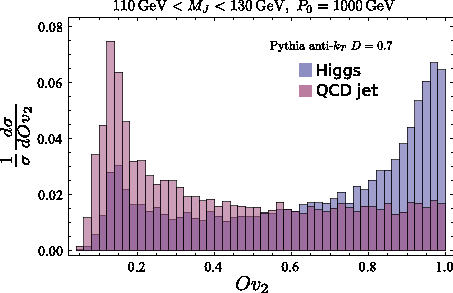 | Comparison of histograms of template overlap $Ov$ with Higgs jets and QCD jets from different MCs [from top to bottom, {\sc Pythia}, {\sc Sherpa} and {\sc Madgraph}], for $R=0.7$, 950 GeV$\le P_{0} \le$1050 GeV, 110 GeV$\le m_J \le$130 GeV and $m_{H}=120$ GeV using 2-body templates (left) and 3-body templates (right). |
 | Comparison of histograms of template overlap $Ov$ with Higgs jets and QCD jets from different MCs [from top to bottom, {\sc Pythia}, {\sc Sherpa} and {\sc Madgraph}], for $R=0.7$, 950 GeV$\le P_{0} \le$1050 GeV, 110 GeV$\le m_J \le$130 GeV and $m_{H}=120$ GeV using 2-body templates (left) and 3-body templates (right). |
 | Comparison of histograms of template overlap $Ov$ with Higgs jets and QCD jets from different MCs [from top to bottom, {\sc Pythia}, {\sc Sherpa} and {\sc Madgraph}], for $R=0.7$, 950 GeV$\le P_{0} \le$1050 GeV, 110 GeV$\le m_J \le$130 GeV and $m_{H}=120$ GeV using 2-body templates (left) and 3-body templates (right). |
 | Comparison of histograms of template overlap $Ov$ with Higgs jets and QCD jets from different MCs [from top to bottom, {\sc Pythia}, {\sc Sherpa} and {\sc Madgraph}], for $R=0.7$, 950 GeV$\le P_{0} \le$1050 GeV, 110 GeV$\le m_J \le$130 GeV and $m_{H}=120$ GeV using 2-body templates (left) and 3-body templates (right). |
 | Comparison of histograms of template overlap $Ov$ with Higgs jets and QCD jets from different MCs [from top to bottom, {\sc Pythia}, {\sc Sherpa} and {\sc Madgraph}], for $R=0.7$, 950 GeV$\le P_{0} \le$1050 GeV, 110 GeV$\le m_J \le$130 GeV and $m_{H}=120$ GeV using 2-body templates (left) and 3-body templates (right). |
 | Comparison of histograms of template overlap $Ov$ with Higgs jets and QCD jets from different MCs [from top to bottom, {\sc Pythia}, {\sc Sherpa} and {\sc Madgraph}], for $R=0.7$, 950 GeV$\le P_{0} \le$1050 GeV, 110 GeV$\le m_J \le$130 GeV and $m_{H}=120$ GeV using 2-body templates (left) and 3-body templates (right). |
 | Density plots of planar flow $Pf$ {\it vs.}\ template overlap $Ov$ for Higgs jets and QCD jets from {\sc Pythia}\cite{pythia8}, for $R=0.7$, 950 GeV$\le P_{0} \le$1050 GeV, 110 GeV$\le m_J \le$130 GeV using three-body templates. |
 | Density plots of $Pf$ {\it vs.} partonic template $Pf$ for Higgs decay events from LO parton-level MC output (left) and {\sc Pythia} (right), with $P_0=1\TeV$, $m_{H}=120\GeV.$ The intensity of the shading is proportional to the density of points. |
 | Density plots of $x_1$ vs. $x_2$ for Higgs signal (blue) and QCD background (red), for the LHC. {\sc Madgraph} hard parton-level (top) and showered jet level with {\sc Pythia } (bottom). Both are shown only in the Higgs mass window $110 \GeV < m_J< 130\GeV$, with $P_0=1\TeV$, $m_{H}=120\GeV.$ |
 | A selection of various template variable distributions for Higgs jets (blue) and QCD background (purple) at the LHC. Events satisfy selection cuts and the Higgs mass window cut, $110 \GeV < m_J<130\GeV$. Horizontal axes are in radians or dimensionless units as appropriate, and vertical axes are in arbitrary units with signal and background normalized to the same area. |
 | A selection of various template variable distributions for Higgs jets (blue) and QCD background (purple) at the LHC. Events satisfy selection cuts and the Higgs mass window cut, $110 \GeV < m_J<130\GeV$. Horizontal axes are in radians or dimensionless units as appropriate, and vertical axes are in arbitrary units with signal and background normalized to the same area. |
 | A selection of various template variable distributions for Higgs jets (blue) and QCD background (purple) at the LHC. Events satisfy selection cuts and the Higgs mass window cut, $110 \GeV < m_J<130\GeV$. Horizontal axes are in radians or dimensionless units as appropriate, and vertical axes are in arbitrary units with signal and background normalized to the same area. |
 | A selection of various template variable distributions for Higgs jets (blue) and QCD background (purple) at the LHC. Events satisfy selection cuts and the Higgs mass window cut, $110 \GeV < m_J<130\GeV$. Horizontal axes are in radians or dimensionless units as appropriate, and vertical axes are in arbitrary units with signal and background normalized to the same area. |
 | A selection of various template variable distributions for Higgs jets (blue) and QCD background (purple) at the LHC. Events satisfy selection cuts and the Higgs mass window cut, $110 \GeV < m_J<130\GeV$. Horizontal axes are in radians or dimensionless units as appropriate, and vertical axes are in arbitrary units with signal and background normalized to the same area. |
 | A selection of various template variable distributions for Higgs jets (blue) and QCD background (purple) at the LHC. Events satisfy selection cuts and the Higgs mass window cut, $110 \GeV < m_J<130\GeV$. Horizontal axes are in radians or dimensionless units as appropriate, and vertical axes are in arbitrary units with signal and background normalized to the same area. |
 | Density plots of 2-body overlap {\it vs.}\ 3-body overlap for boosted Higgs and QCD jets with $R=0.7$ and same number of events (20000). |
 | Density plots of $Pf$ vs $\bar \theta$ for anti-$k_T$ $R=0.7$ jets for Higgs signal (left) and QCD background (right) at the LHC with selection cuts and quality cut $Ov_2>0.8$ and $Ov_3>0.8$. |
 | Comparison of fake rate \textit{vs.} signal efficiency with various cuts on three-body template overlap $Ov_3$ with Higgs jets and QCD jets. The curves represent variations on the minimal value of two-body template overlap $Ov_2$\@. The frames show results from different MC [top {\sc Pythia}, middle {\sc Sherpa}, and bottom {\sc MG/ME} with $R=0.4$ (left) and $R=0.7$ (right)], for a Higgs mass window selection criteria $110\GeV < m_J<130\GeV$ and $950\GeV < P_0<1050\GeV$. Both efficiency and fake rates decrease as we increase the overlap cut. The dashed curves denote the case when $Pf$ cut is implemented, while the solid curves have no $Pf$ cut. }fake |
 | Comparison of fake rate \textit{vs.} signal efficiency with various cuts on three-body template overlap $Ov_3$ with Higgs jets and QCD jets. The curves represent variations on the minimal value of two-body template overlap $Ov_2$\@. The frames show results from different MC [top {\sc Pythia}, middle {\sc Sherpa}, and bottom {\sc MG/ME} with $R=0.4$ (left) and $R=0.7$ (right)], for a Higgs mass window selection criteria $110\GeV < m_J<130\GeV$ and $950\GeV < P_0<1050\GeV$. Both efficiency and fake rates decrease as we increase the overlap cut. The dashed curves denote the case when $Pf$ cut is implemented, while the solid curves have no $Pf$ cut. }fake |
 | Comparison of fake rate \textit{vs.} signal efficiency with various cuts on three-body template overlap $Ov_3$ with Higgs jets and QCD jets. The curves represent variations on the minimal value of two-body template overlap $Ov_2$\@. The frames show results from different MC [top {\sc Pythia}, middle {\sc Sherpa}, and bottom {\sc MG/ME} with $R=0.4$ (left) and $R=0.7$ (right)], for a Higgs mass window selection criteria $110\GeV < m_J<130\GeV$ and $950\GeV < P_0<1050\GeV$. Both efficiency and fake rates decrease as we increase the overlap cut. The dashed curves denote the case when $Pf$ cut is implemented, while the solid curves have no $Pf$ cut. }fake |
 | Comparison of fake rate \textit{vs.} signal efficiency with various cuts on three-body template overlap $Ov_3$ with Higgs jets and QCD jets. The curves represent variations on the minimal value of two-body template overlap $Ov_2$\@. The frames show results from different MC [top {\sc Pythia}, middle {\sc Sherpa}, and bottom {\sc MG/ME} with $R=0.4$ (left) and $R=0.7$ (right)], for a Higgs mass window selection criteria $110\GeV < m_J<130\GeV$ and $950\GeV < P_0<1050\GeV$. Both efficiency and fake rates decrease as we increase the overlap cut. The dashed curves denote the case when $Pf$ cut is implemented, while the solid curves have no $Pf$ cut. }fake |
 | Comparison of fake rate \textit{vs.} signal efficiency with various cuts on three-body template overlap $Ov_3$ with Higgs jets and QCD jets. The curves represent variations on the minimal value of two-body template overlap $Ov_2$\@. The frames show results from different MC [top {\sc Pythia}, middle {\sc Sherpa}, and bottom {\sc MG/ME} with $R=0.4$ (left) and $R=0.7$ (right)], for a Higgs mass window selection criteria $110\GeV < m_J<130\GeV$ and $950\GeV < P_0<1050\GeV$. Both efficiency and fake rates decrease as we increase the overlap cut. The dashed curves denote the case when $Pf$ cut is implemented, while the solid curves have no $Pf$ cut. }fake |
 | Comparison of fake rate \textit{vs.} signal efficiency with various cuts on three-body template overlap $Ov_3$ with Higgs jets and QCD jets. The curves represent variations on the minimal value of two-body template overlap $Ov_2$\@. The frames show results from different MC [top {\sc Pythia}, middle {\sc Sherpa}, and bottom {\sc MG/ME} with $R=0.4$ (left) and $R=0.7$ (right)], for a Higgs mass window selection criteria $110\GeV < m_J<130\GeV$ and $950\GeV < P_0<1050\GeV$. Both efficiency and fake rates decrease as we increase the overlap cut. The dashed curves denote the case when $Pf$ cut is implemented, while the solid curves have no $Pf$ cut. }fake |
 | Efficiency versus mistag rate for the Template Overlap method and the BDRS Higgs tagger. The filled curves represent variations on the minimal value of three-body template overlap $Ov_3$\@, while the dashed curve corresponds to a varying mass window for the filtered jet mass, $m_{filt}$. The results are from {\sc Pythia 8} with $R=0.7$ and same selection criteria as in the template case above. |
 | noimg: Efficiencies and fake rates for jets with $R=0.4$ (using anti-$k_T$: $D=0.4$), 950 GeV$\le P_{0} \le$1050 GeV, 110 GeV$\le m_J \le$130 GeV and $m_{H}=120$ GeV. The left pair of columns shows efficiencies and fake rates found by imposing the jet mass window only. The right pair takes into account the effects of cuts in both $Ov's$, $\bar \theta$ and $Pf$ in addition to the mass window. For the different MC simulations, we have imposed various cuts on $Ov$, $\bar \theta$ and $Pf$ variables: for {\sc Pythia v8}~\cite{pythia8} $Ov_2\ge 0.8$, $Ov_3\ge 0.8$, $\bar \theta<0.4$ and $Pf < 0.2$, for {\sc MG/ME}~\cite{madgraph} interfaced to {\sc Pythia v6}~\cite{pythia6}(with MLM matching~\cite{mlm}) $Ov_2\ge 0.8$, $Ov_3 >0.8$, $\bar \theta<0.4$ and $Pf< 0.2$ and for {\sc Sherpa}~\cite{sherpa} (with CKKW matching~\cite{ckkw}) $Ov_2\ge 0.7$, $Ov_3 >0.7$, $\bar \theta<0.45$ and $Pf< 0.3$.: Efficiencies and fake rates for jets with $R=0.7$ (using anti-$k_T$: $D=0.7$), 950 GeV$\le P_{0} \le$1050 GeV, 110 GeV$\le m_J \le$130 GeV and $m_{H}=120$ GeV. The left pair of columns shows efficiencies and fake rates found by imposing the jet mass window only. The right pair takes into account the effects of cuts in both $Ov's$, $\bar \theta$ and $Pf$ in addition to the mass window. For the different MC simulations, we have imposed various cuts on $Ov$, $\bar \theta$ and $Pf$ variables: for {\sc Pythia v8}~\cite{pythia8} $Ov_2\ge 0.8$, $Ov_3\ge 0.8$, $\bar \theta<0.4$ and $Pf < 0.2$, for {\sc MG/ME}~\cite{madgraph} interfaced to {\sc Pythia v6}~\cite{pythia6}(with MLM matching~\cite{mlm}) $Ov_2\ge 0.8$, $Ov_3 >0.8$, $\bar \theta<0.4$ and $Pf< 0.2$ and for {\sc Sherpa}~\cite{sherpa} (with CKKW matching~\cite{ckkw}) $Ov_2\ge 0.7$, $Ov_3 >0.7$, $\bar \theta<0.45$ and $Pf< 0.3$. |
 | A schematic diagram of a Higgs production process and decay. For our study, the Higgs boson is assumed to be exactly on-shell. |
 | The values of $f_3$ and $f_2$ from Eq. (\ref{jade3})-(\ref{jade2}). Notice that the choice $y=0.05$ corresponds to roughly $f_2=0.8$ and $f_3=0.2$\@. |