Measurement of very forward neutron energy spectra for 7 TeV proton--proton collisions at the Large Hadron Collider
- Adriani, O. et al
- arXiv:1503.03505CERN-PH-EP-DRAFT-LHCF-2015-001CERN-PH-EP-2015-056
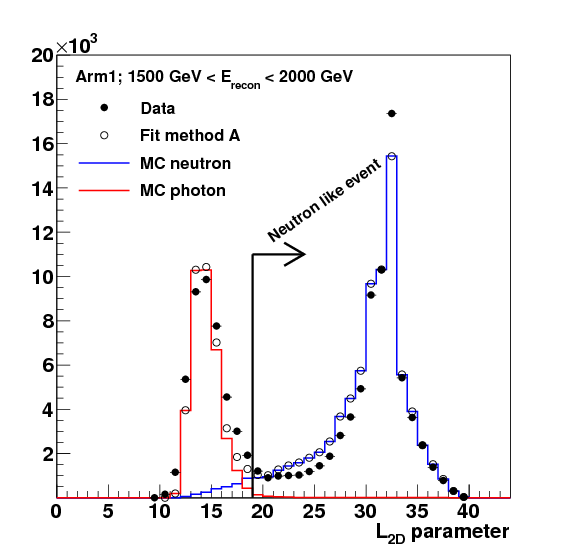 | The L$_{{\rm 2D}}$ parameter distribution for the experimental data and the MC simulations from the template MC. The closed circles represent the Arm1 experimental results, whereas the red and blue histograms correspond to photon and neutron predictions. The open circles is the scaled results of the MC simulation obtained by method A. |
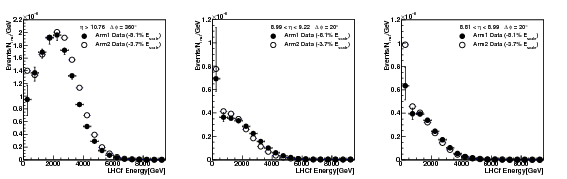 | Energy spectra of neutron-like events measured by the Arm1 and Arm2 detectors. The left panel shows the results from the small towers, and the center and right panels show the results for the large towers. The horizontal axes represent the reconstructed energy. The vertical bars represent the statistical (they are negligibly small) and systematic uncertainties except the energy scale and the luminosity uncertainties. |
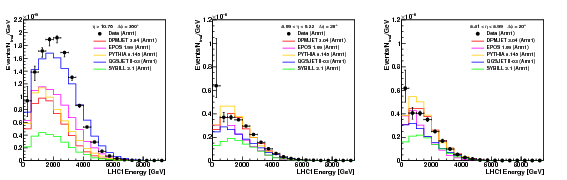 | Measured Arm1 energy spectra of neutron-like events together with MC predictions. Left panel shows the results for the small tower, and the center and right panels show the results for the large tower. The vertical bars represent the statistical (they are very small) and systematic uncertainties except the energy scale and luminosity uncertainties. Colored lines indicate MC predictions by EPOS 1.99 (magenta), QGSJET II-03 (blue), SYBILL 2.1 (green), DPMJET 3.04 (red), and PYTHIA 8.145 (yellow). |
 | Comparison of unfolded spectra with true spectra for DPMJET 3.04 and EPOS 1.99 models at the small tower of Arm1. Bottom panel shows the ratio of the unfolded spectra to the true spectra. |
 | Unfolded energy spectra of the small towers ($\eta>10.76$) and the large towers ($8.99 < \eta<9.22$ and $8.81<\eta<8.99$). The hatched areas show the Arm1 systematic errors, and the bars represent the Arm2 systematic errors except the luminosity uncertainty.. |
 | Comparison of the LHCf results with model predictions at small tower ($\eta>10.76$) and large towers ($8.99 < \eta<9.22$ and $8.81<\eta<8.99$). The black markers and gray hatched areas show the combined results of the LHCf Arm1 and Arm2 detectors and the systematic errors, respectively. |