Webstat Guide
Index
About WebstatLogging in
Current System Health
Key Statistics
Custom Events
Error Log Statistics
Library Report
Collections Stats
About Webstat
This module is accessed via Administration>Statistics, and is available to privileged users only. It allows you to review measurements taken of Invenio usage and performance. The resulting output is available in several formats with its raw data also being available for export, this is to allow for offline processing.
A hit is when a user calls up the web page
Logging in
You have to log in as this module is only available to users who have been given access.
Once logged in, access via Administration>Statistics

Current System Health

- Total active visitors
- Searches since midnight
- Basket page hits
- Alerts page hits
- Yearly report (related to library/Bibcirculation module)
Key Statistics

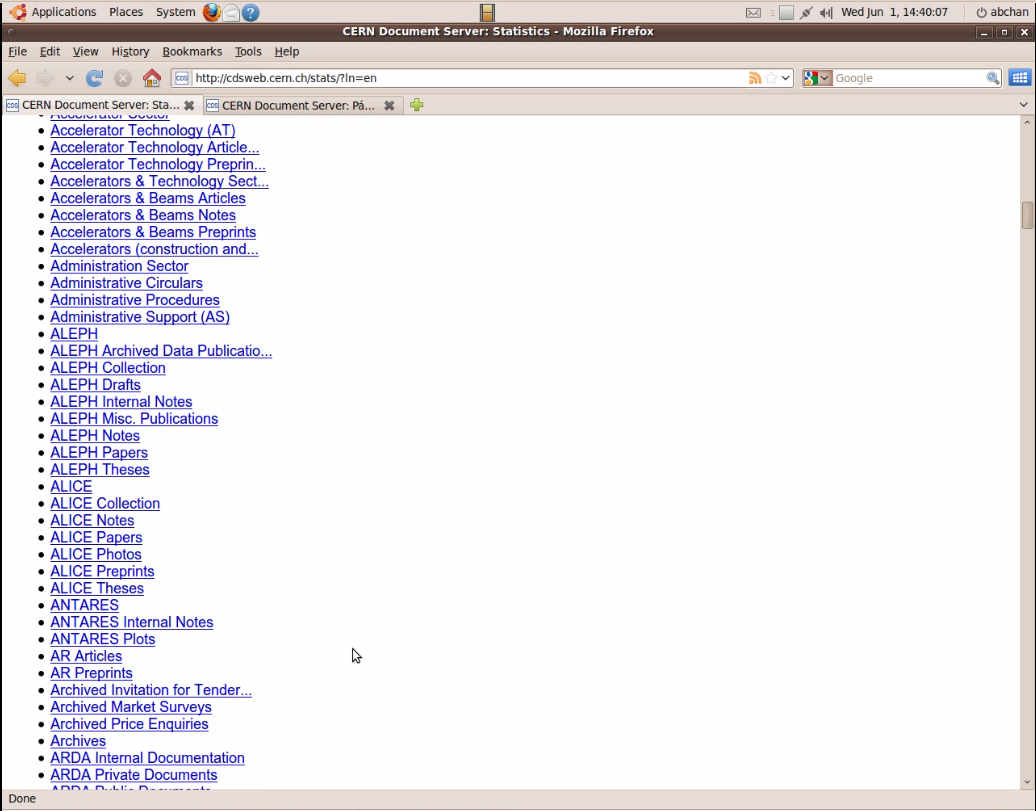
These are graphs or lists for all the collections within CDS
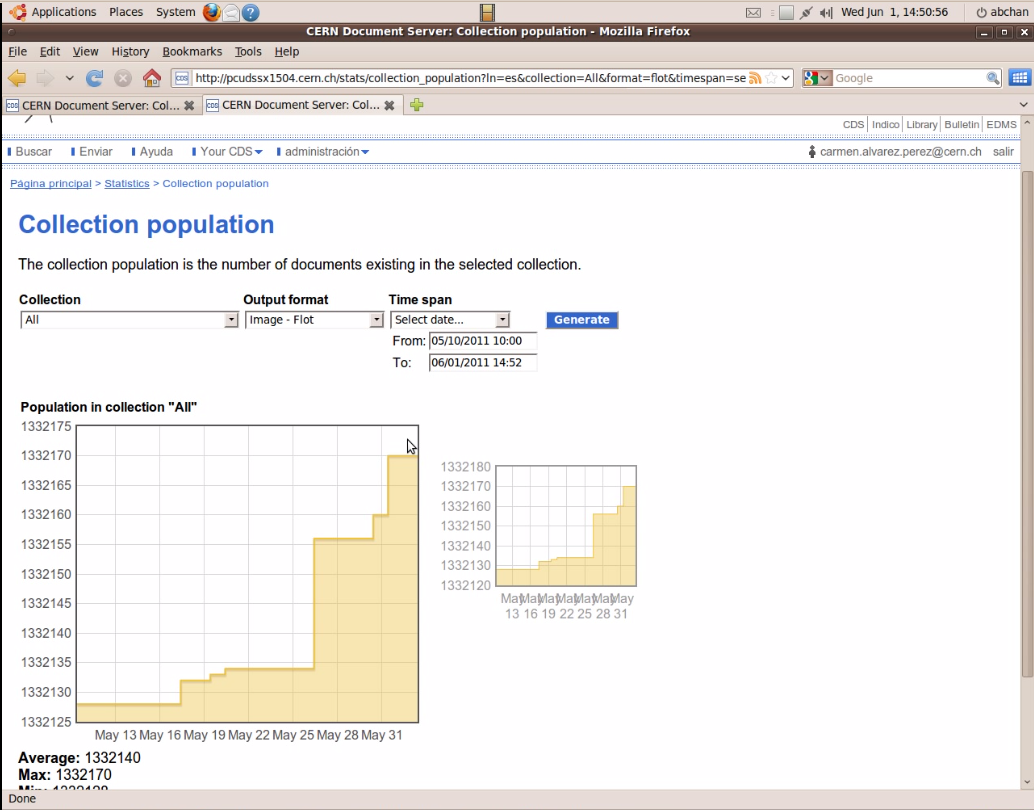
- ‘Collection population’ displays the relationship of the number of records in a collection with regards to time. You have the possibility of selecting a time span in the drop-down list or you can specify the time period in which you are interested in by ‘Select date’ in the box ‘Time span’. As well as the time span, you can select the output format that you would prefer, and then press ‘Generate’. The output formats that are available are as follows:
- Image – Gnuplot (graph)
- Image – ASCII art (text)
- Image – Flot (graph)
- Data – Python code (text)
- Data – CSV (text)
- ‘New records’ is similar to the ‘collection population’ except that it shows the number of new records submitted into the system, and not the total number of records.
- The ‘Search frequency’, displays the number of searches performed in a specific time period.
- ‘Search type distribution’, shows the number of simple searches and advanced searches according to time.
- The ‘Download frequency’ shows the number of full-text downloads over time.
- The ‘Comments frequency’ displays the number of comments for a collection over a time period.
- ‘Web submissions’ displays the number of submissions that are done via the web (ie not harvested) for a particular collection against time.
- ‘Loans statistics’ (for library use) allows you to see the statistics of the number of documents and items loaned over a time period; you can specify the Universal Decimal Classification Number if you wish.
- ‘Loans lists’ (for library use) shows the number of loans for the copies of a document over a time period; you can specify the Universal Decimal Classification Number if you wish.
- ‘Renewals list’ (for library use) displays the list of most renewed items for a chosen time span.
- ‘Number of overdue returns’ (for library use) lists the number of items that are or were overdue for the specified time period. Returning an item does not alter this statistic as the item would still be overdue.
- ‘Returns graph’ (for library use) shows the overdue returns and the total number of returns. The ‘overdue returns’ never exceeds the total number of returns.
- ‘ILL Requests statistics’ (for library use) displays statistics for Inter-Library Loan (ILL) requests; parameters such as the status of the ILL request, the supplier (other library), the type of document and the time period can be specified for the generation of the statistics of satisfied ILL requests. Note that requests that are cancelled tend to be tests, and therefore are not normally included in the total.
- ‘ILL Requests list’ (for library use) shows the first 50 requests according to the search criteria. Cancelled requests are not shown. In order to see more than 50 requests you would click on ‘Full list’ and open the data file in an appropriate application (e.g. Excel).
- ‘Percentage of satisfied ILL requests’ (for library use) displays a graph of the ILL requests whereby the requester received the item. The unsatisfied requests are also visible.
- ‘Items statistics’ (for library use) shows the total number of items and the total number of new items within the time span specified.
- ‘Items list’ (for library use) shows a list of the items that is available for ILL at the selected library. You can also specify the status of the order (‘Cancelled’, ‘In process’, ‘On loan’) in the search list. ‘Full list’ allows you to open the data file in an appropriate application (e.g. Excel).
- ‘Hold requests statistics’ (for library use) displays the statistics to do with items that are on loan but that are then requested. For instance, the number of successful hold requests transactions is shown.
- ‘Loan request lists’ (for library use) displays the most requested items for the specified time period. ‘Full list’ allows you to open the data file in an appropriate application (e.g. Excel).
- ‘User statistics’ (for library use) shows the number of active users in the time period selected. The users that are counted will have carried out at least one transaction – an ILL request and/or a loan.
- ‘Users lists’ (for library use) displays those users who are the most intensive users, i.e. make the highest number of ILL requests and loans. ‘Full list’ allows you to open the data file in an appropriate application (e.g. Excel).
Custom Events
Statistical data recording that are customized according to the user’s request may be carried out, however, only after the events have been specified and defined can statistics begin to be recorded. You can select a custom event within a time period and generate the statistics using the following parameters:
- Baskets
- action - can take following values:
- display_public
- add
- display
- edit
- create_basket
- delete_note
- modify
- search
- delete
- write_note
- list_public_baskets
- basket – can take the following values:
- name or number of the basket (like EMC or 17601). You can see the number of the basket in the url (https://cds.cern.ch/yourbaskets/display?category=G&group=25494&bskid=17601 => bskid (the basket id) is 17601.
- user – can take the following values:
- e-mail or user id
- Alerts
- action - can take the following values:
- list
- display
- input
- add
- modify
- remove
- update
- alert - can take the following values:
- name or number of the alert (like test or 8388205). You can see the number of the alert in the url (https://cds.cern.ch/youralerts/add?name=test&freq=month¬if=y&idb=0&idq=8388205 => the alert id is 8388205)
- user – can take following values:
- user’s e-mail or user’s id
- ejournal
- publication
- volume
- year
- page
- source
- ip
- media_view
- file – can take the following values:
- reference (CERN-MOVIE-1975-001) or indico confId (a041812).
- type - can take the following values:
- movie
- format - can take the following values:
- Flv
- wmv
- mp4
- ip - can take the following values:
- ip address of the person who saw the media
- external - can take the following values:
- "external" if it is external
- empty if it is in CDS
- recid - can take the following values:
- number of the record that contains the media (e.g., 1100786)
- loanrequest – waiting on particular bibCirculation code before this can work
- journals – number of views for each article
- action
- journal name
- issue_number
- category
- language
- articleid
Error Log Statistics
These statistics show last errors that have occurred in CDS, in the Invenio and Apache logs.
- Error log analyzer - This is for developers
Library Report
This contains the customised statistics for the Library Yearly Report
- Custom query summary – list of journals for the Library.
Collections Stats
The Collections Stats are graphs showing the number of documents, downloads (of full-text), comments for records in each collection (cf Key Statistics – Collection population, Download frequency, Comments frequency). The collections are as follows:
- Articles & Preprints
- Books & Proceedings
- Presentations & Talks
- Periodicals & Progress Reports
- Multimedia & Outreach
- Other collections – select any one of the collections in CDS