Measurements of longitudinal and transverse momentum distributions for neutral pions in the forward-rapidity region with the LHCf detector
- Adriani, O. et al
- arXiv:1507.08764CERN-PH-EP-2015-201
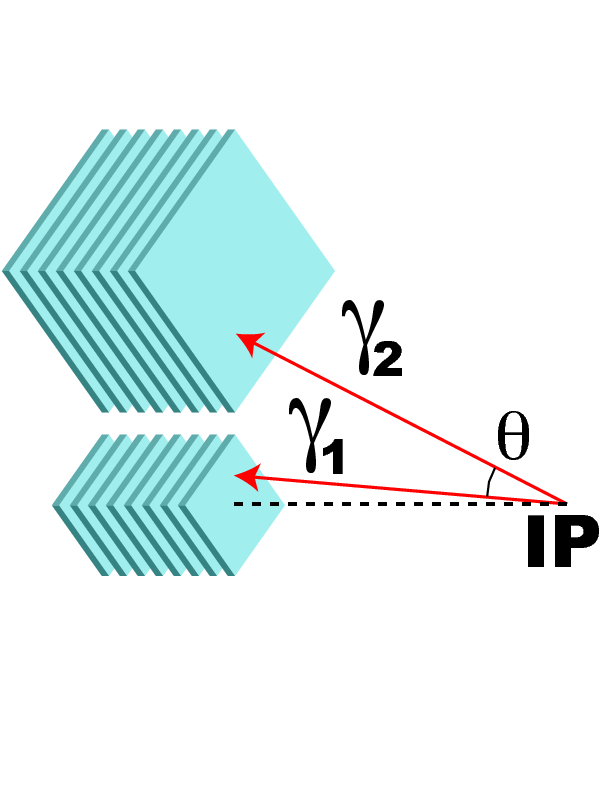 | (color online). Observation of $\pizero$ decay by a LHCf detector. Left: Type-I $\pizero$ event having one photon entering each calorimeter. Right: Type-II $\pizero$ event having two photons entering one calorimeter, here entering the small calorimeter. |
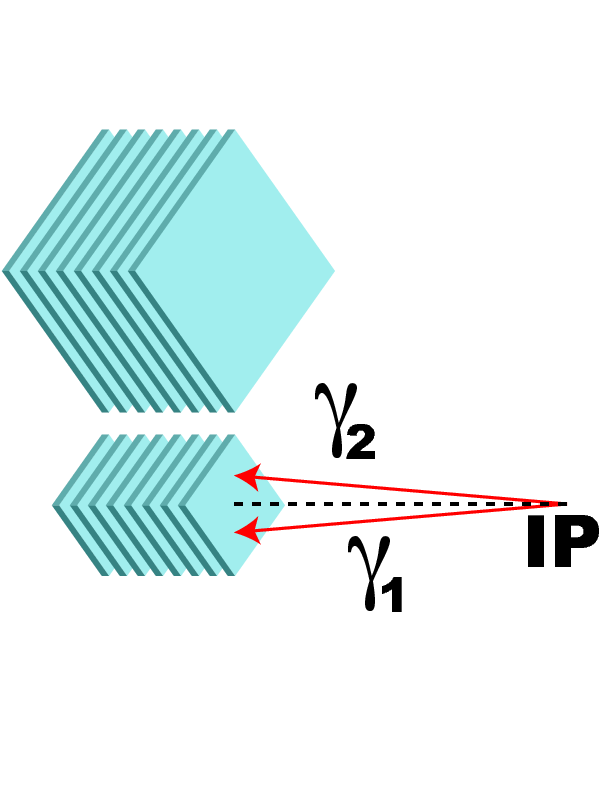 | (color online). Observation of $\pizero$ decay by a LHCf detector. Left: Type-I $\pizero$ event having one photon entering each calorimeter. Right: Type-II $\pizero$ event having two photons entering one calorimeter, here entering the small calorimeter. |
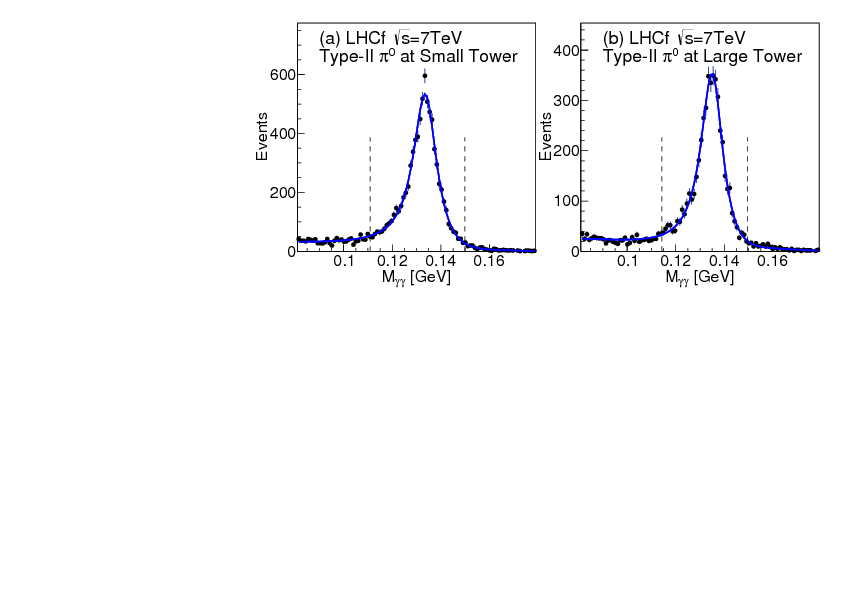 | (color online). Reconstructed invariant mass distributions in $\pp$ collisions at $\sqs=\tev{7}$. Left: Type-II $\pizero$ events in the Arm2 small calorimeter. Right: Type-II $\pizero$ events in the Arm2 large calorimeter. The solid curves show the best-fit composite physics model to the invariant mass distributions. |
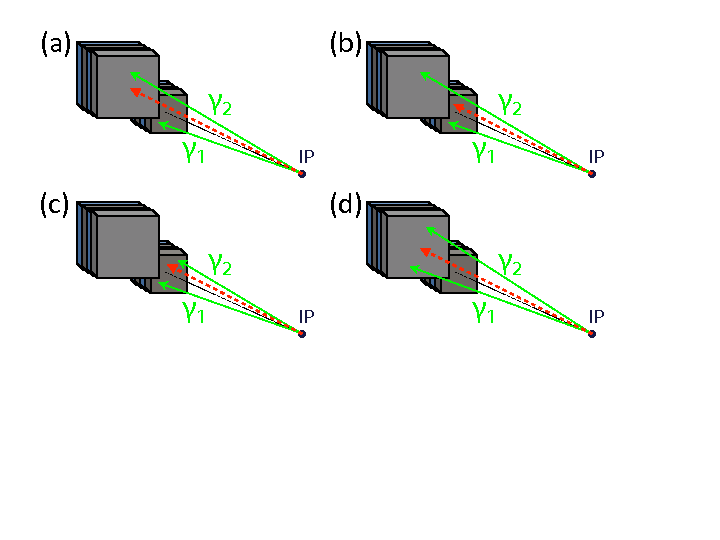 | (color online). Diagrams of all multi-hit events that are rejected. Panels (a) and (b) show the multi-hit Type-I $\pizero$ events and panels (c) and (d) show the multi-hit Type-II $\pizero$ events. Red and green arrows indicate a background particle not originating in a $\pizero$ decay and two photons originating in a $\pizero$ decay, respectively. |
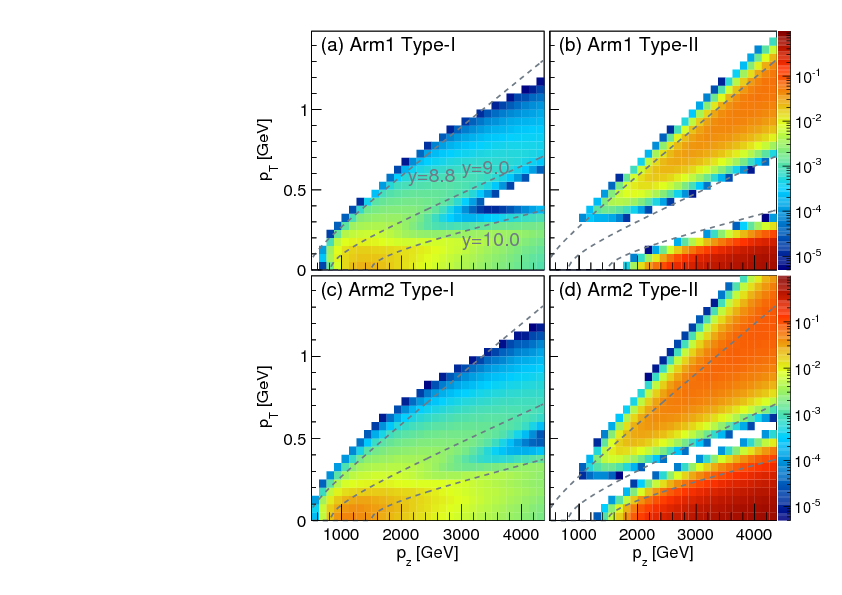 | (color online). The acceptance map of $\pizero$ detection by the LHCf detectors in $\pz$--$\pt$ phase space: Arm1 Type-I (left top), Arm1 Type-II (right top), Arm2 Type-I (left bottom), and Arm2 Type-II (right bottom). The fiducial area cuts and energy threshold ($E_{\text{photon}}>\gev{100}$) are taken into account. Dashed curves indicate lines of constant rapidity $\pizero$s, $y$ = 8.8, 9.0, and 10.0 reading from top to bottom. |
 | (color online). LHCf $\pt$ distributions (filled circles) in $\pp$ collisions at $\sqs=\tev{7}$. Error bars indicate the total statistical and systematic uncertainties. The predictions of hadronic interaction models are shown for comparison: \textsc{dpmjet} (solid red line), \textsc{qgsjet} (dashed blue line), \textsc{sibyll} (dotted green line), \textsc{epos} (dashed-dotted magenta line), and \textsc{pythia} (dashed-double-dotted brown line). |
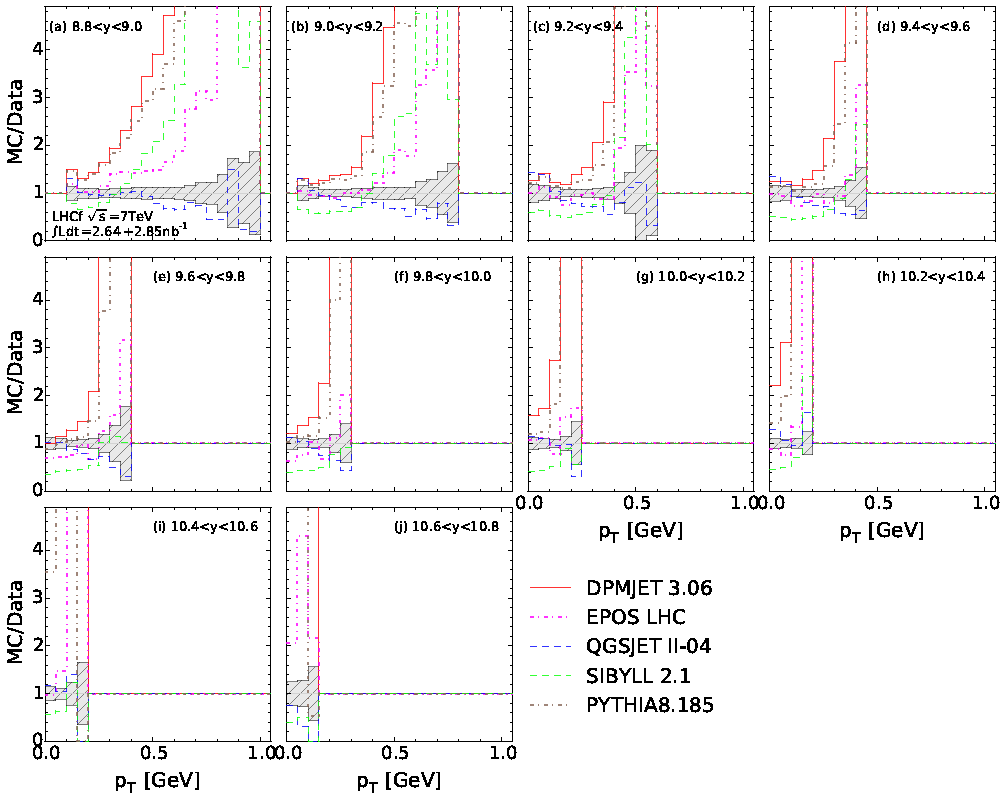 | (color online). Ratios of LHCf $\pt$ distributions to the $\pt$ distributions predicted by hadronic interaction models in $\pp$ collisions at $\sqs=\tev{7}$ are shown by solid red line (\textsc{dpmjet}), dashed blue line (\textsc{qgsjet}), dotted green line (\textsc{sibyll}), dashed-dotted magenta line (\textsc{epos}), and dashed-double-dotted brown line (\textsc{pythia}). Shaded areas indicate the range of total uncertainties of the LHCf $\pt$ distributions. |
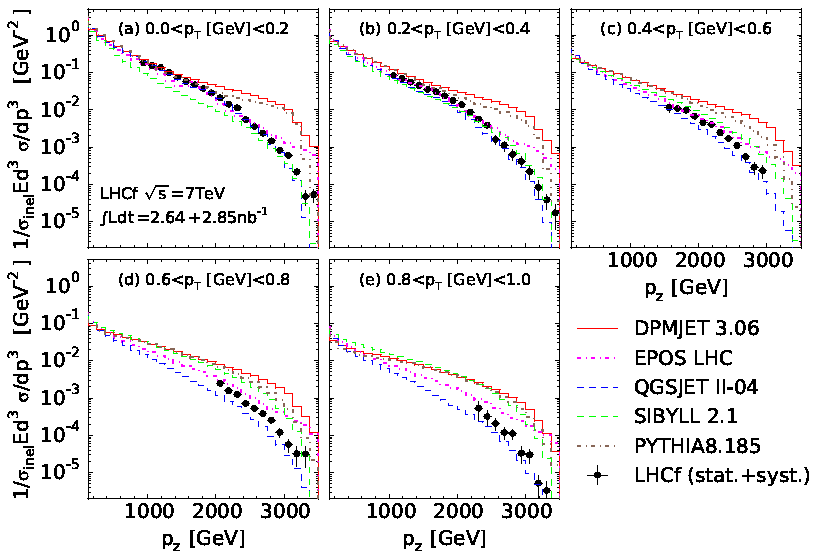 | (color online). LHCf $\pz$ distributions (filled circles) in $\pp$ collisions at $\sqs=\tev{7}$. Error bars indicate the total statistical and systematic uncertainties. The predictions of hadronic interaction models are shown for comparison: \textsc{dpmjet} (solid red line), \textsc{qgsjet} (dashed blue line), \textsc{sibyll} (dotted green line), \textsc{epos} (dashed-dotted magenta line), and \textsc{pythia} (dashed-double-dotted brown line). |
 | (color online). Ratios of LHCf $\pz$ distributions to the $\pz$ distributions predicted by hadronic interaction models in $\pp$ collisions at $\sqs=\tev{7}$ are shown by solid red line (\textsc{dpmjet}), dashed blue line (\textsc{qgsjet}), dotted green line (\textsc{sibyll}), dashed-dotted magenta line (\textsc{epos}), and dashed-double-dotted brown line (\textsc{pythia}). Shaded areas indicate the range of total uncertainties of the LHCf $\pz$ distributions. |
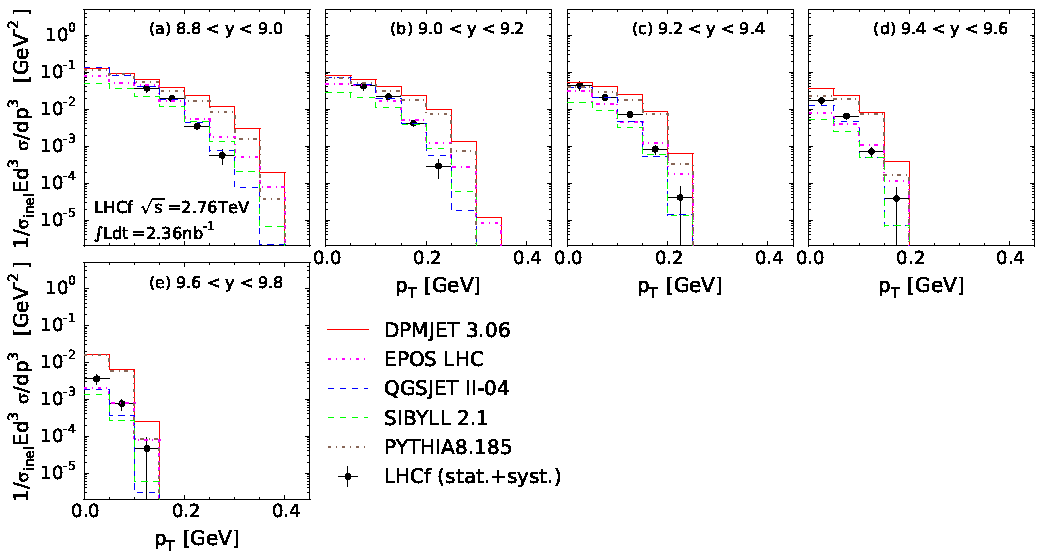 | (color online). LHCf $\pt$ distributions (filled circles) in $\pp$ collisions at $\sqs=\tev{2.76}$. Error bars indicate the total statistical and systematic uncertainties. The predictions of hadronic interaction models are shown for comparison: \textsc{dpmjet} (solid red line), \textsc{qgsjet} (dashed blue line), \textsc{sibyll} (dotted green line), \textsc{epos} (dashed-dotted magenta line), and \textsc{pythia} (dashed-double-dotted brown line). |
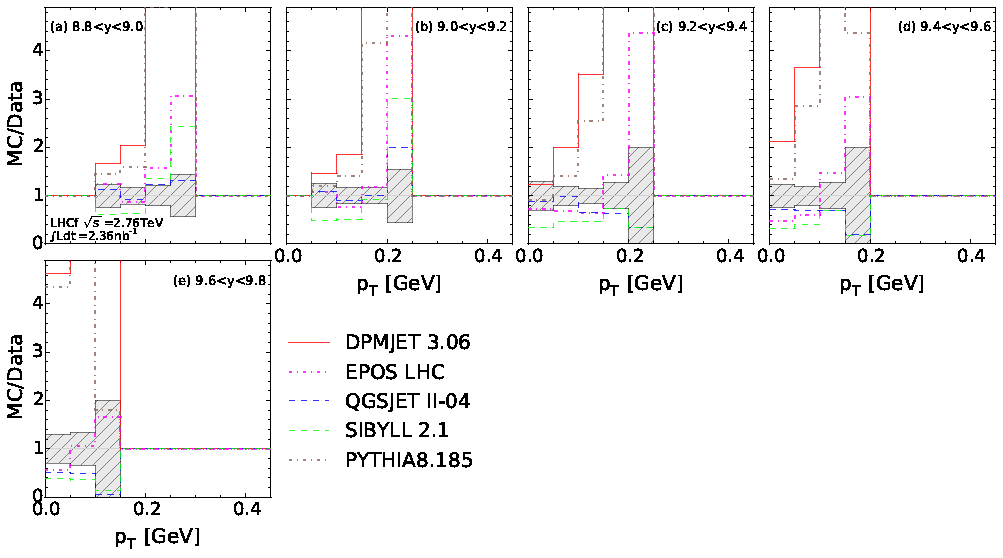 | (color online). Ratios of LHCf $\pt$ distributions to the $\pt$ distributions predicted by hadronic interaction models in $\pp$ collisions at $\sqs=\tev{2.76}$ are shown by solid red line (\textsc{dpmjet}), dashed blue line (\textsc{qgsjet}), dotted green line (\textsc{sibyll}), dashed-dotted magenta line (\textsc{epos}), and dashed-double-dotted brown line (\textsc{pythia}). Shaded areas indicate the range of total uncertainties of the $\pt$ spectra. |
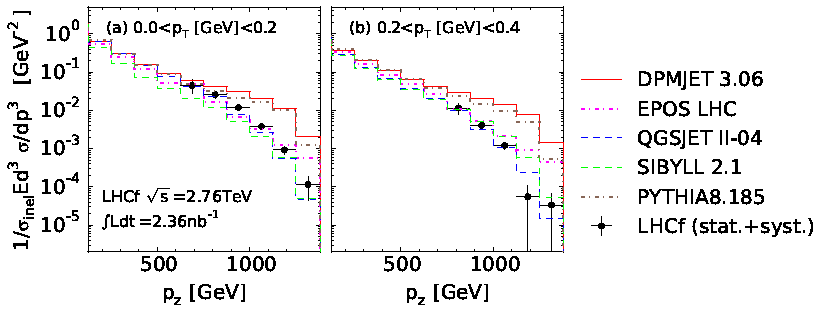 | (color online). LHCf $\pz$ distributions (filled circles) in $\pp$ collisions at $\sqs=\tev{2.76}$. Error bars indicate the total statistical and systematic uncertainties. The predictions of hadronic interaction models are shown for comparison: \textsc{dpmjet} (solid red line), \textsc{qgsjet} (dashed blue line), \textsc{sibyll} (dotted green line), \textsc{epos} (dashed-dotted magenta line), and \textsc{pythia} (dashed-double-dotted brown line). |
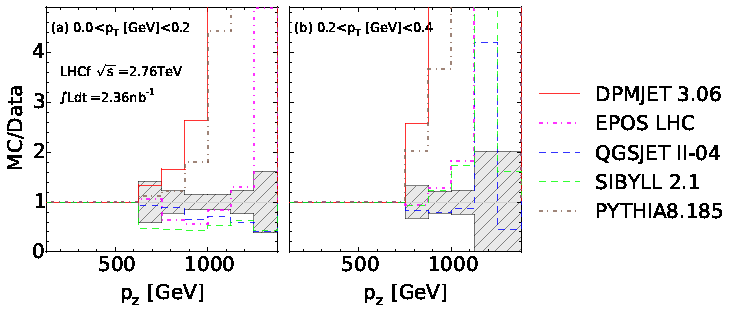 | (color online). Ratios of LHCf $\pz$ distributions to the $\pz$ distributions predicted by hadronic interaction models in $\pp$ collisions at $\sqs=\tev{2.76}$ are shown by solid red line (\textsc{dpmjet}), dashed blue line (\textsc{qgsjet}), dotted green line (\textsc{sibyll}), dashed-dotted magenta line (\textsc{epos}), and dashed-double-dotted brown line (\textsc{pythia}). Shaded areas indicate the range of total uncertainties of the $\pz$ distributions. |
 | (color online). LHCf $\pt$ distributions (filled circles) in $\pPb$ collisions at $\snn=\tev{5.02}$. Error bars indicate the total statistical and systematic uncertainties. The predictions of hadronic interaction models are shown for comparison: \textsc{dpmjet} (solid red line), \textsc{qgsjet} (dashed blue line), and \textsc{epos} (dashed-dotted magenta line). |
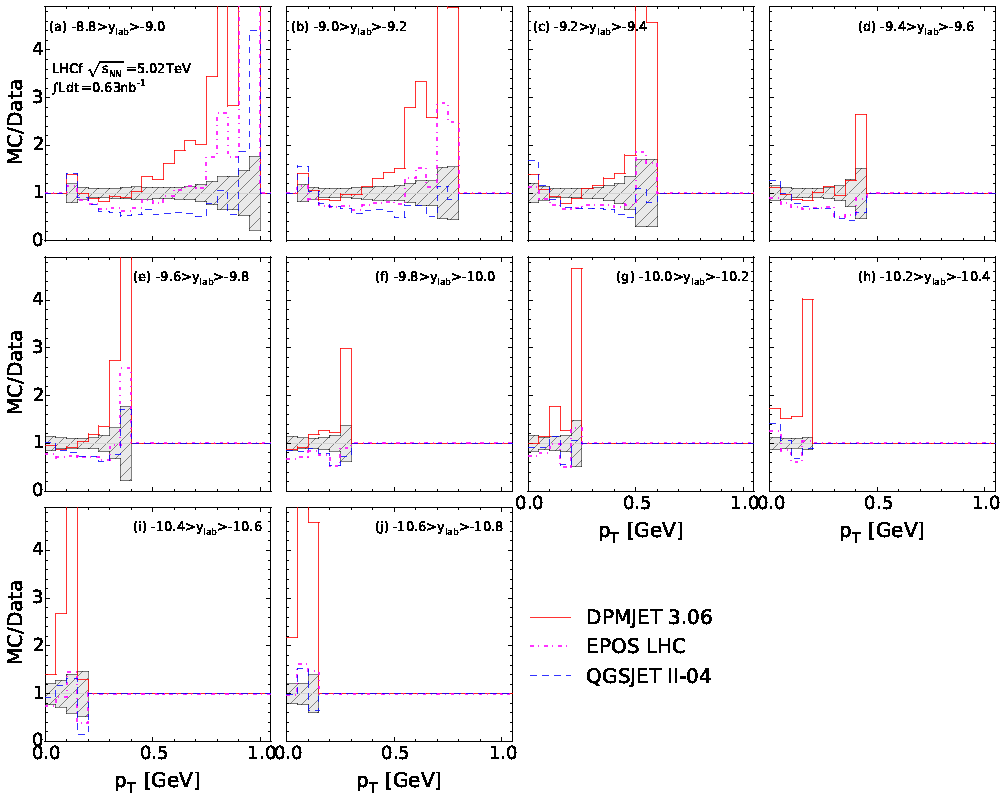 | (color online). Ratios of LHCf $\pt$ distributions to the $\pt$ distributions predicted by hadronic interaction models in $\pPb$ collisions at $\snn=\tev{5.02}$ are shown by solid red line (\textsc{dpmjet}), dashed blue line (\textsc{qgsjet}), and dashed-dotted magenta line (\textsc{epos}). Shaded areas indicate the range of total uncertainties of the $\pt$ distributions. |
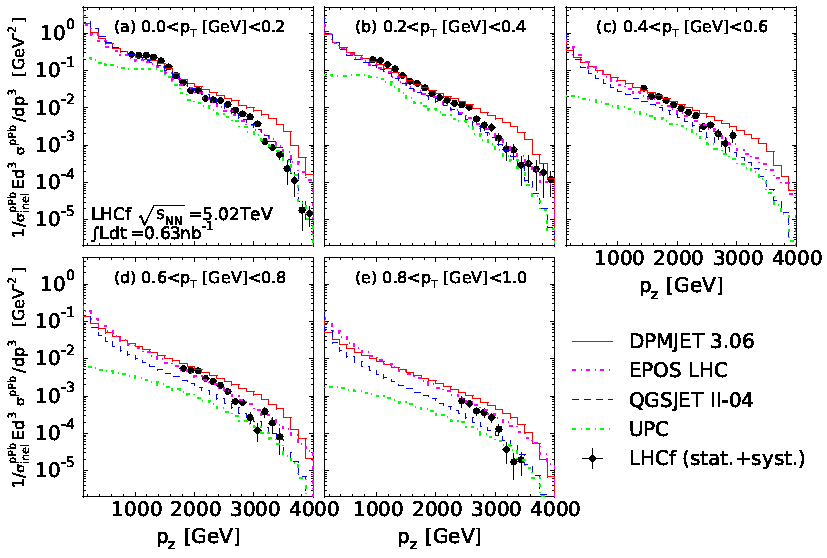 | (color online). LHCf $\pz$ distributions (filled circles) in $\pPb$ collisions at $\snn=\tev{5.02}$. Error bars indicate the total statistical and systematic uncertainties. The predictions of hadronic interaction models are shown for comparison: \textsc{dpmjet} (solid red line), \textsc{qgsjet} (dashed blue line), and \textsc{epos} (dashed-dotted magenta line). |
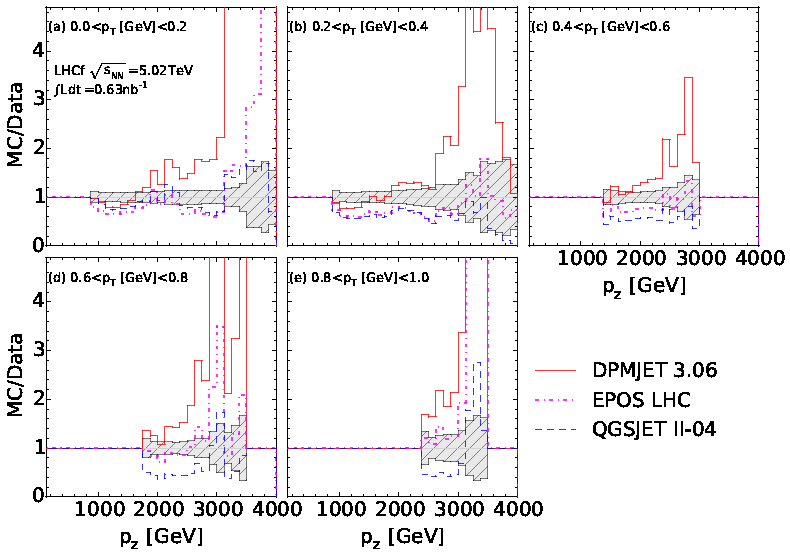 | (color online). Ratios of LHCf $\pz$ distributions to the $\pz$ distributions predicted by hadronic interaction models in $\pPb$ collisions at $\snn=\tev{5.02}$ are shown by solid red line (\textsc{dpmjet}), dashed blue line (\textsc{qgsjet}), and dashed-dotted magenta line (\textsc{epos}). Shaded areas indicate the range of total uncertainties of the $\pt$ distributions. |
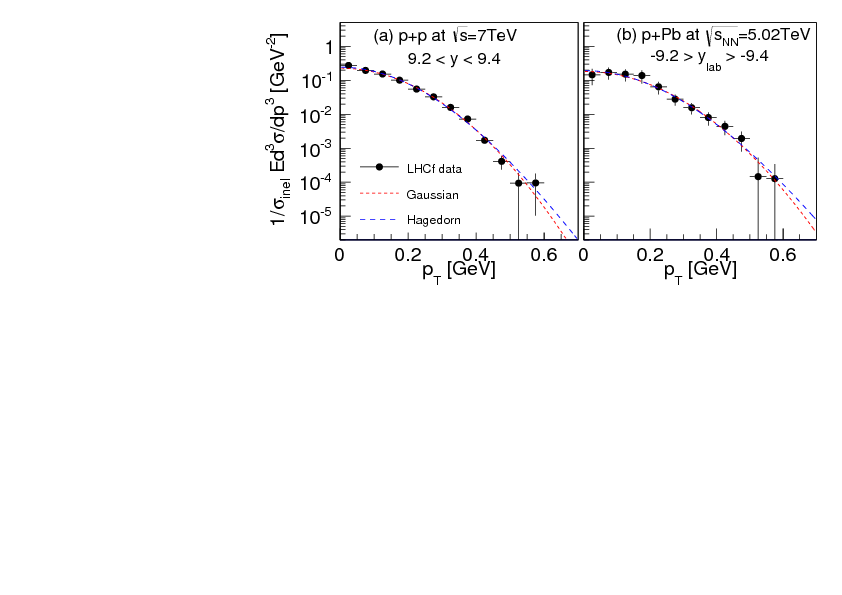 | (color online). LHCf $\pt$ distributions (filled black circles), the best-fit Gaussian distributions (dotted red curve), and the best-fit Hagedorn functions (dashed blue curve). Left: the data for $\pp$ collisions at $\sqs=\tev{7}$. Right: the data for $\pPb$ collisions at $\snn=\tev{5.02}$. |
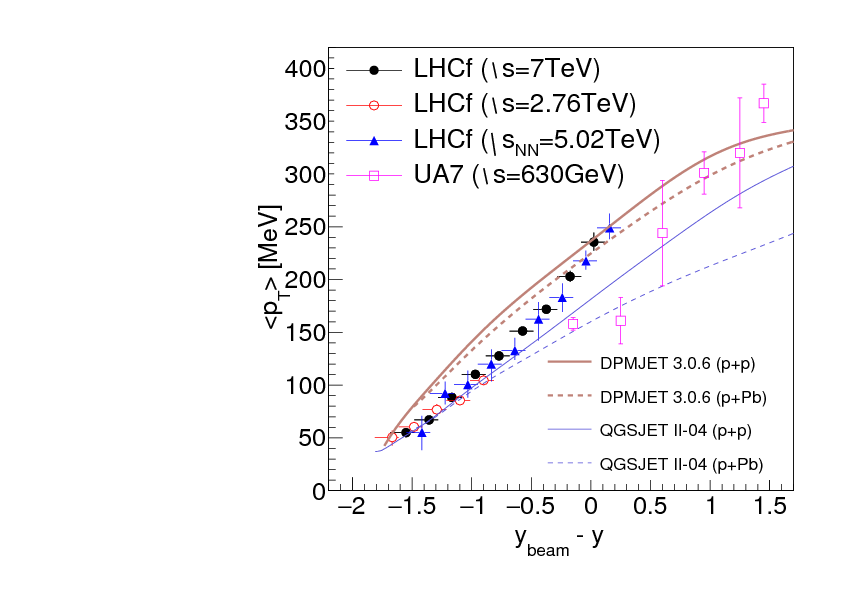 | (color online). Average $\pt$ as a function of rapidity loss $\deltay = \ybeam-y$. Open red circles and filled black circles indicate LHCf data in $\pp$ collisions at $\sqs=2.76$ and $\tev{7}$, respectively. The results of the UA7 experiment (open magenta box) at Sp$\bar{\text{p}}$S ($p+\bar{p}$ collisions at $\sqs=\gev{630}$) and the predictions from \textsc{dpmjet} (thick lines) and \textsc{qgsjet} (thin lines) are added for reference. |
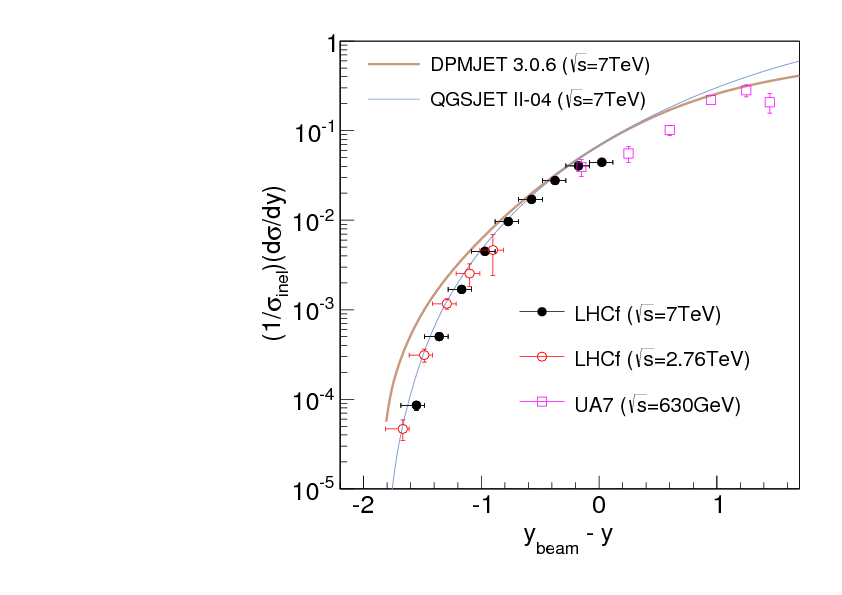 | (color online). The $\pizero$ yield in each rapidity interval as a function of rapidity loss $\deltay = \ybeam-y$. Open red circles and filled black circles indicate LHCf data in $\pp$ collisions at $\sqs=2.76$ and $\tev{7}$, respectively. The results of the UA7 experiment (open magenta squares) at Sp$\bar{\text{p}}$S ($p+\bar{p}$ collisions at $\sqs=\gev{630}$) and the predictions by \textsc{dpmjet} (thick red line) and \textsc{qgsjet} (thin blue line) are added for reference. |
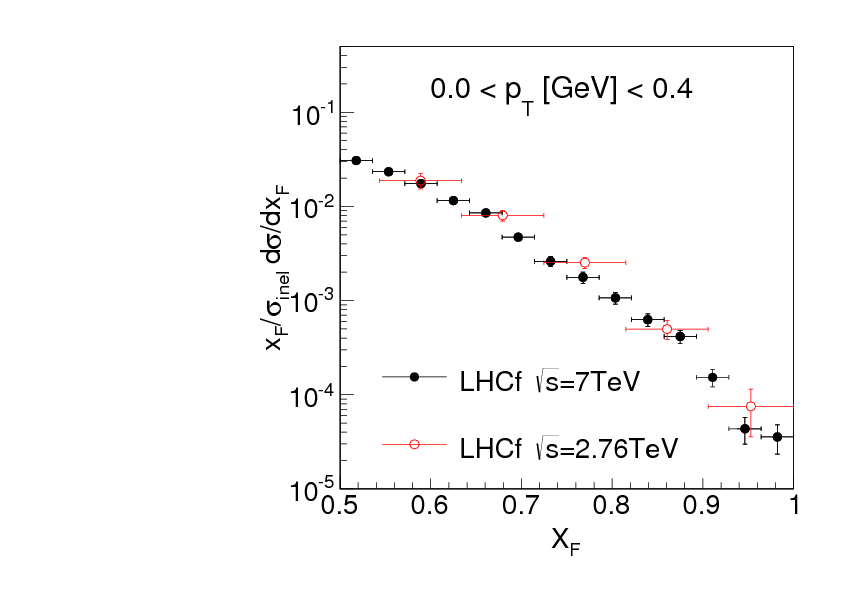 | (color online). The $\pizero$ yield at $0.0<\pt<\gev{0.4}$ as a function of $\xf$. Open red circles and filled black circles indicate LHCf data in $\pp$ collisions at $\sqs=2.76$ and $\tev{7}$, respectively. |
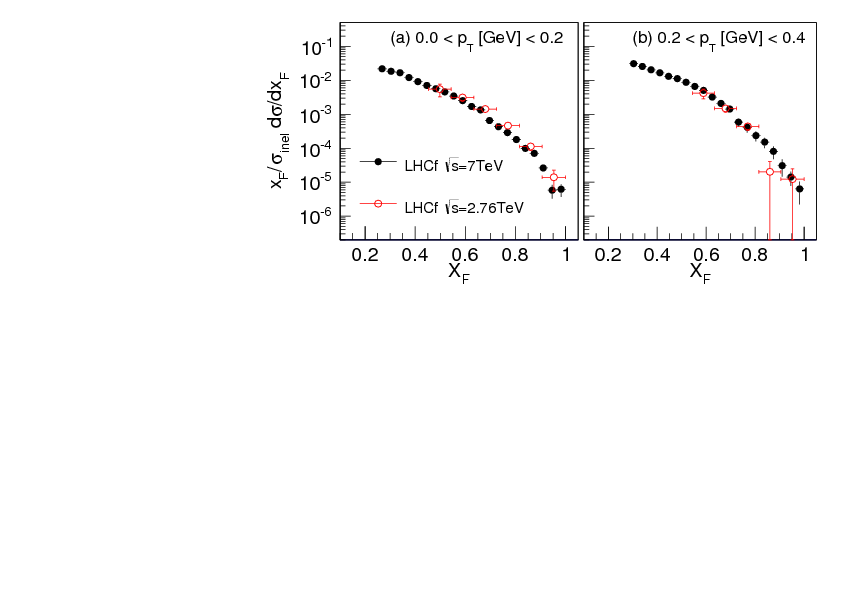 | (color online). The $\pizero$ yield in each $\pt$ range as a function of $\xf$. Left: the distributions for $0.0<\pt<\gev{0.2}$. Right: the distributions for $0.2<\pt<\gev{0.4}$. Open red circles and filled black circles indicate LHCf data in $\pp$ collisions at $\sqs=2.76$ and $\tev{7}$, respectively. |
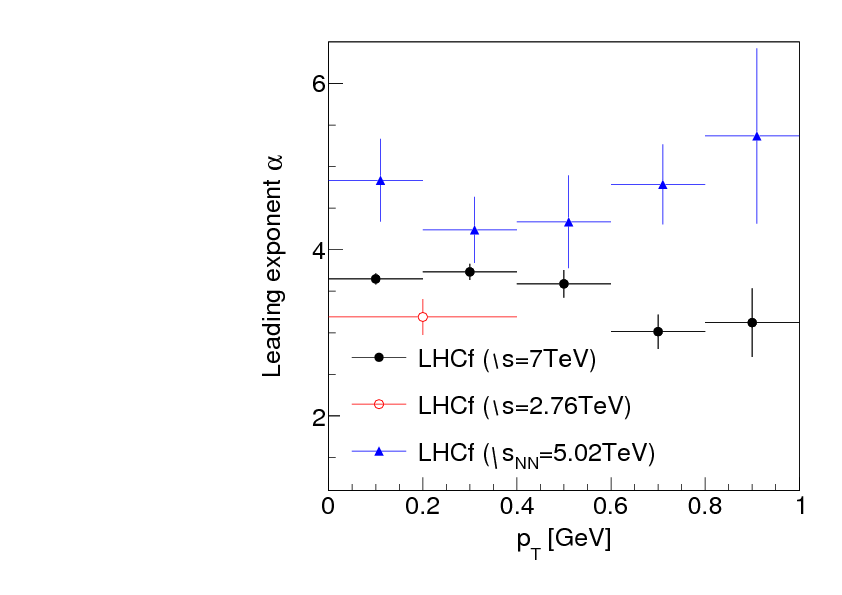 | (color online). The best-fit leading exponent of (1-$\xf$) as a function of $\pt$. Open red circles and filled black circles indicate LHCf data in $\pp$ collisions at $\sqs=2.76$ and $\tev{7}$, respectively. Filled blue triangles indicate LHCf data in $\pPb$ collisions at $\snn=\tev{5.02}$. |
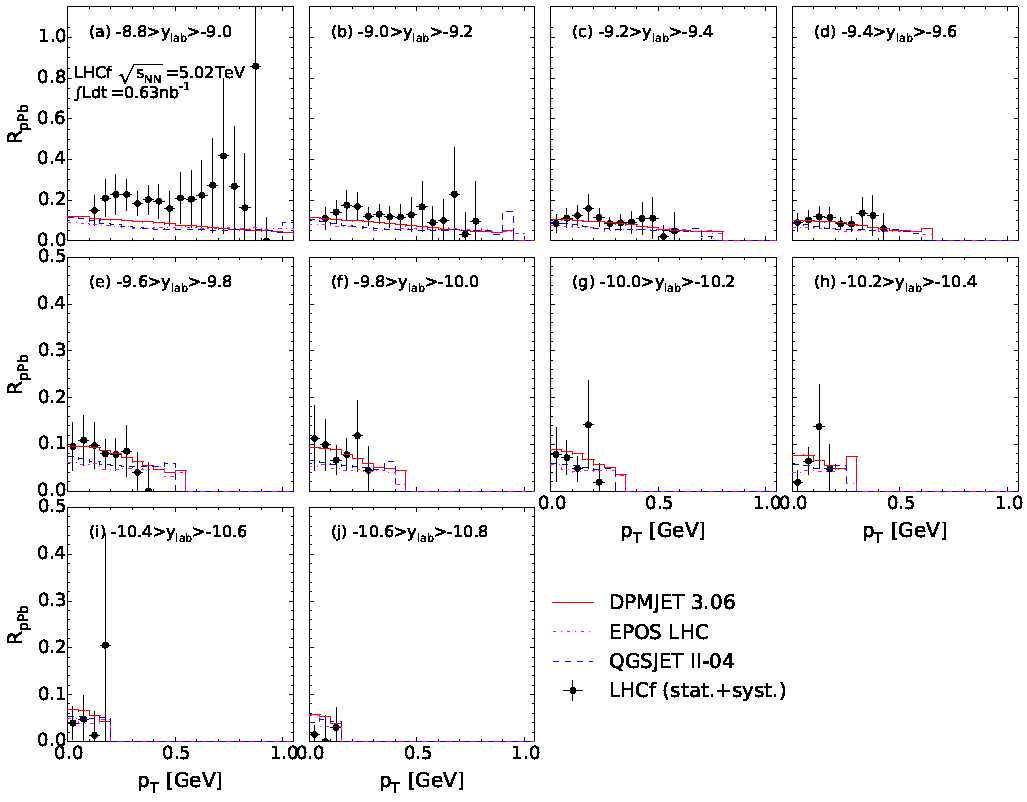 | (color online). The nuclear modification factor for $\pizero$s. Filled circles indicate the factors obtained from LHCf data. Error bars indicate the total uncertainties incorporating both statistical and systematic uncertainties. Other lines are the predictions from hadronic interaction models: \textsc{dpmjet} (solid red line), \textsc{qgsjet} (dashed blue line), and \textsc{epos} (dashed-dotted magenta line). |