High efficiency veto hadron calorimeter in the NA64 experiment at CERN
- Andreev, Yu.M. et al
- arXiv:2503.11275CERN-EP-2025-04
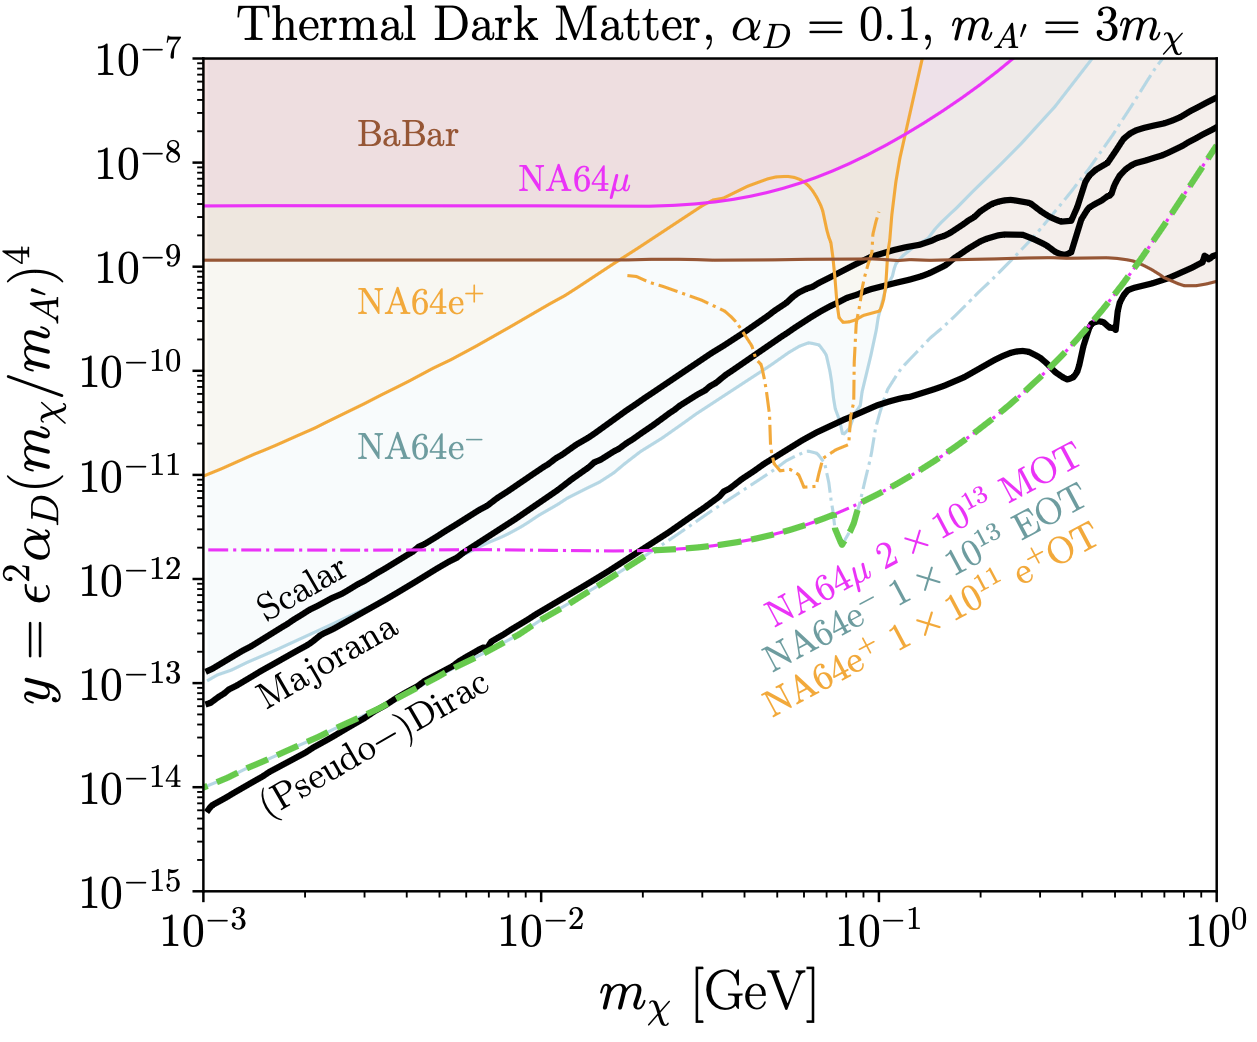 | Current NA64 $90\%$ C.L. exclusion limits on the Dark Photon scenario $\Apr\rightarrow$~invisible, in the exploration with $e^{-}$ (solid \textcolor{colorLightBlue}{light blue} line), $e^{+}$ (solid \textcolor{colorYellow}{yellow} line) and $\mu$ (solid \textcolor{colorPink}{pink} line) beams \cite{NA64:2024nwj}. The combined projection is displayed as a \textcolor{colorGreen}{green} dashed line and is obtained from the projections of the individual programs (dash-dotted lines with the respective colors) for the statistics to be collected during the LHC Run 4. |
 | The NA64 setup in the invisible mode configuration during the 2023 run at the H4 beamline. The red arrows correspond to a schematic representation of the particle shower as a result of upstream electron-nuclear interactions in one of the Micromegas trackers by the primary electron. See text for further details. |
 | Distribution of events in the $\left(E_{\mathrm{EC}}; E_{\mathrm{HC}}\right)$ plane before (left) and after (middle) applying a cut on the total VHCAL energy for a subset of the total statistics collected during the 2023 run, with the signal-region blinding condition still applied, after all other selection criteria are applied. The impact of the cut in the estimated number of background events is highlighted by the extrapolation of the tails in the sideband $E_{\mathrm{HC}}<\SI{1.5}{GeV}$ (right). Most of the events removed by the VHCAL cut lie close to the signal box and likely correspond to secondary hadrons that escape the HCAL acceptance. The gray crosshatched region represents the systematic uncertainty from the fitting procedure, defined by the area between fits with the minimum and maximum integral obtained by varying the fitting range. |
 | Preliminary NA64 $90\%$ C.L. exclusion limits (dashed lines) obtained in case of no observed signal for the dark photon ($\Apr$) to invisible search in the $(m_{\Apr}, \epsilon)$ plane for the combined 2016-2023. The exclusion limits are drawn for two choices of the signal region in the ECAL: $E_{\mathrm{EC}}<\SI{50}{GeV}$ in \textcolor{colorOrange}{orange} and $E_{\mathrm{EC}}<\SI{60}{GeV}$ in \textcolor{colorRed}{red}. This is only applied to the 2023 dataset and showcases the improved sensitivity enabled by the prototype VHCAL. |
 | Sketch of an event with electroproduction of hadrons in the MM tracker placed between the vacuum vessel and the VHCAL. Drawn in dashed red arrows are the trajectories of possible hadrons with high transverse momentum. The blue, dotted arrow follows the scattered electron that impinges on the ECAL. |
 | ECAL energy spectrum for events in the sideband $E_{\mathrm{HC}}<\SI{1.5}{GeV}$ plane before applying a cut on the total VHCAL energy for the blinded sub-period of the 2023 run and the MC sample, after the selection criteria (i)-(vi) are applied. The MC sample is normalized to the number of EOT in the sub-period with the factor $f$ as described in the text. The light-red shaded area corresponds to the signal region in the ECAL plane. The bottom plot displays the ratio $\mathrm{MC}/\mathrm{data}$ for each bin. |
 | VHCAL spectrum for all events before applying a cut on the total VHCAL energy for the blinded sub-period of the 2023 run and the MC sample, after all other selection criteria are applied. The probability density function (pdf) of the MC sample is fitted to the data after the convolution with a Gaussian distribution using \texttt{RooFit}. The bottom plot displays the difference $\mathrm{data}-\mathrm{MC}$ for each bin. |
 | Comparison of the VHCAL energy spectrum (left), $R_{\mathrm{VHC}}$ (center) and $R_{\mathrm{HC}}$ (right) for events with energy deposition in VHCAL, VETO and the first HCAL module. The MC sample is normalized to the number of EOT in the sub-period with the factor $f$ as described in the text. |
 | Comparison of the VHCAL energy spectrum (left), $R_{\mathrm{VHC}}$ (center) and $R_{\mathrm{HC}}$ (right) for events with energy deposition in VHCAL, VETO and the first HCAL module. The MC sample is normalized to the number of EOT in the sub-period with the factor $f$ as described in the text. |
 | Comparison of the VHCAL energy spectrum (left), $R_{\mathrm{VHC}}$ (center) and $R_{\mathrm{HC}}$ (right) for events with energy deposition in VHCAL, VETO and the first HCAL module. The MC sample is normalized to the number of EOT in the sub-period with the factor $f$ as described in the text. |
 | A rendering of the simulated geometry without (left), with the current prototype tested in the 2023 run (middle) and with a full-scale (right) VHCAL. Drawn are the axes at the end of the vacuum vessel, with the z axis (blue) corresponding to the unbent beam direction. |
 | A rendering of the simulated geometry without (left), with the current prototype tested in the 2023 run (middle) and with a full-scale (right) VHCAL. Drawn are the axes at the end of the vacuum vessel, with the z axis (blue) corresponding to the unbent beam direction. |
 | A rendering of the simulated geometry without (left), with the current prototype tested in the 2023 run (middle) and with a full-scale (right) VHCAL. Drawn are the axes at the end of the vacuum vessel, with the z axis (blue) corresponding to the unbent beam direction. |
 | ECAL spectra of the three simulated configurations for the remaining events in the sideband $E_{\mathrm{HC}}<\SI{1.5}{GeV}$ after applying all invisible selection criteria (i)-(viii). All MC samples were normalized to display the fraction of events per EOT. The light-red shaded area corresponds to the signal region in the ECAL plane. The fit of the remaining distribution of events using the Crystal Ball function are shown with solid, red lines. The dashed, black lines illustrate two exponential fits for the MC sample used to determine the systematic uncertainty from the choice of fitting function and range. |